
Case studies / 01

How we fixed broken analytics in furniture e-commerce and reached 947% ROAS on a limited budget.

Verified client resultE-commerce · Furniture · Poland

Quarter analysed: 1 March – 31 May 2026 (vs 29 Nov 2025 – 28 Feb 2026)

947%
Average ROAS across the quarter
1 075%
Best month (April 2026)
461.9
Conversions (from 5 before the fix)
64.3kPLN
Revenue from Google Ads

The challenge

01
No salesGoogle Ads had run for about two years without delivering sales.
02
Leaking analyticsA free PrestaShop plugin dropped conversion and cart-value data.
03
Tight budgetNo room for spend on unprofitable product groups.

What we did

01
Sealed measurementAn advanced tracking plugin recovered purchase, value and path data.
02
Selected assortmentMargin and potential analysis, then only the key product groups.
03
Rebuilt accountPerformance Max on those groups, a brand campaign and remarketing.

Key takeaways

01
Measurement firstNo account earns if the algorithms learn from broken sales data.
02
Focused budgetOn limited spend, advertise only what actually earns.
03
Closed funnelProduct campaigns, brand and remarketing work together.

Raw platform evidence / 02

Unedited Google Ads screenshots, one row per reporting window. Numbers on the left are read straight from the account.

01 / 05
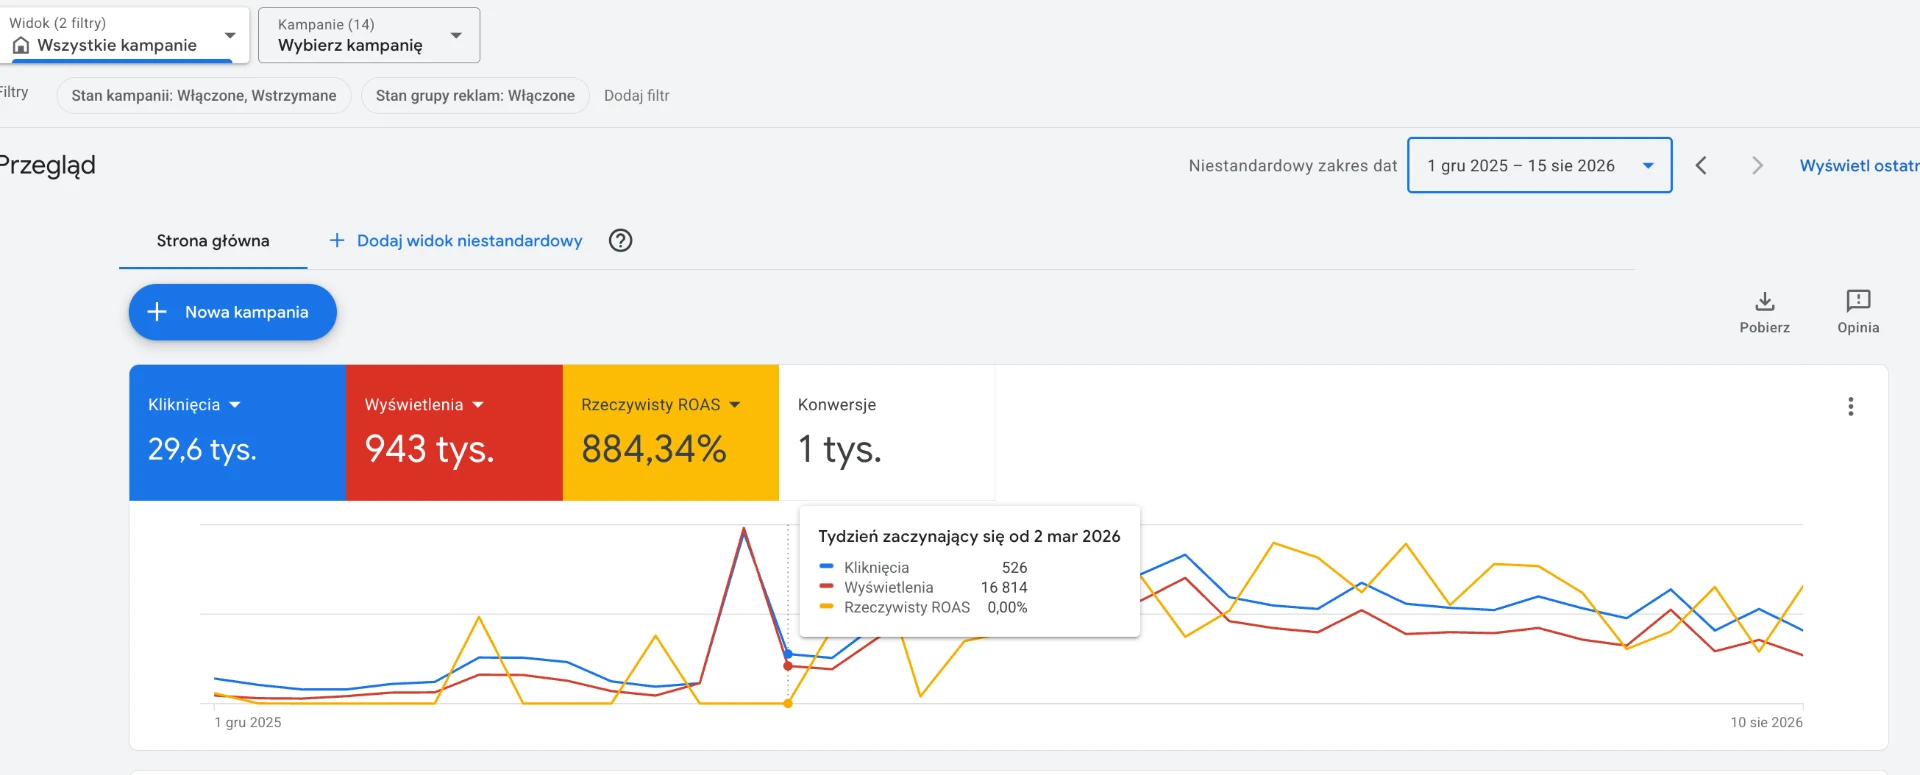
1 Dec 2025 – 15 Aug 2026 · whole account
Clicks
29.6k
Impressions
943k
Actual ROAS
884.34%
Conversions
1k

Full account view after the measurement layer was sealed. The step-change in the curve is the month tracking was fixed.
Google Ads report — 1 Dec 2025 – 15 Aug 2026 · whole account
Google Ads · 1 Dec 2025 – 15 Aug 2026 · whole account
02 / 05
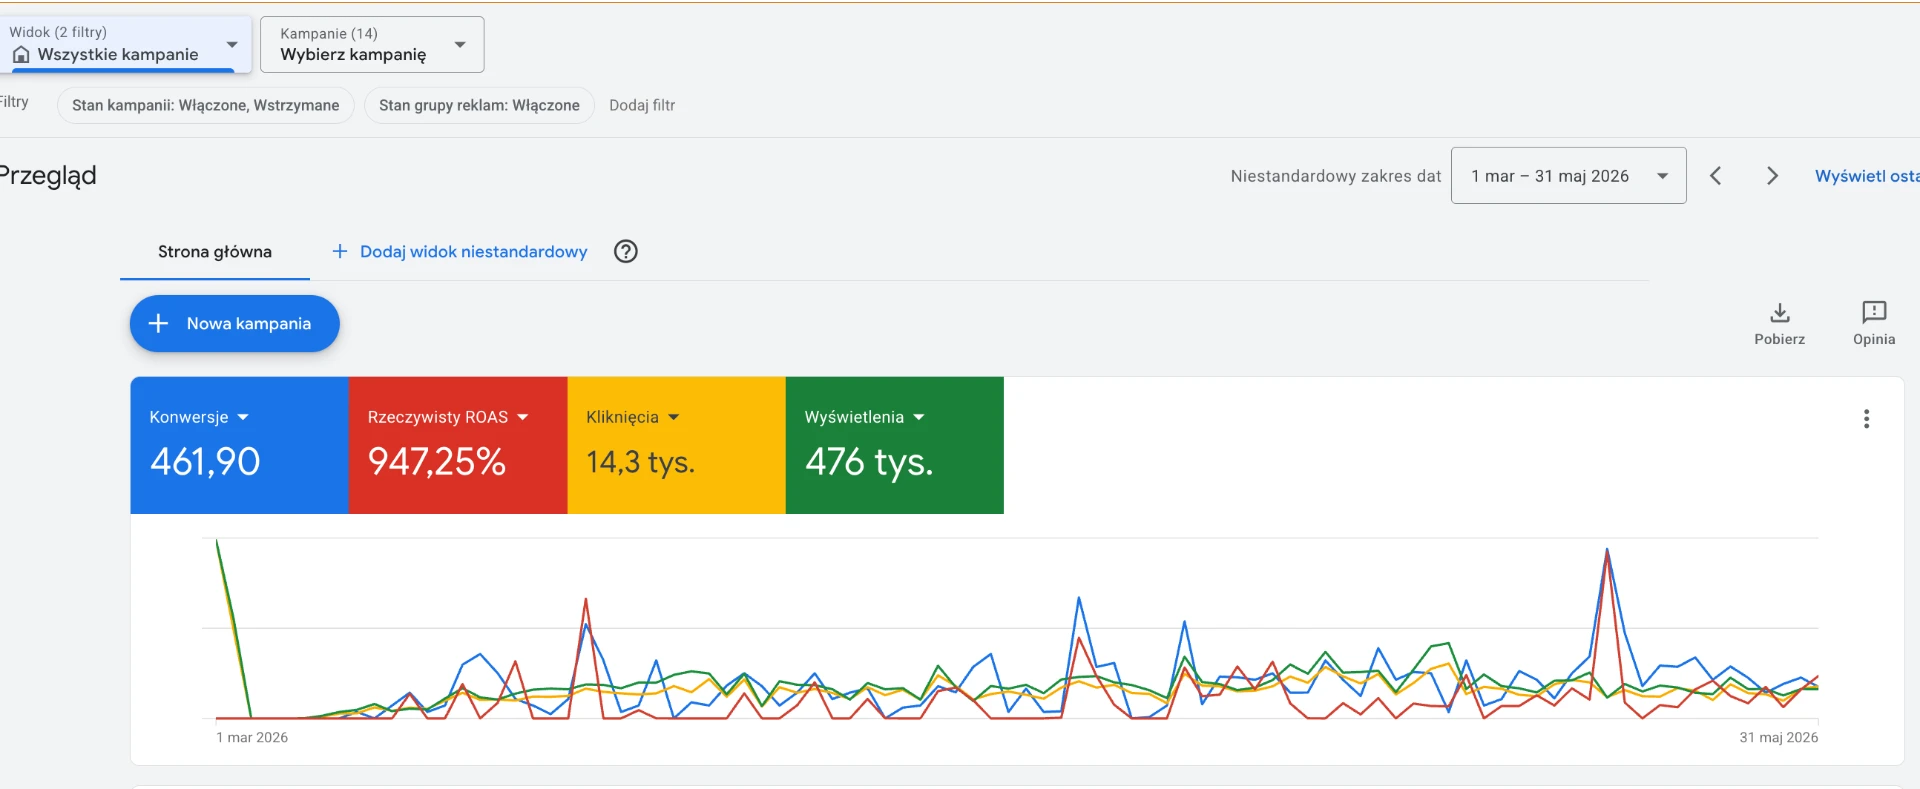
1 Mar – 31 May 2026 · analysed quarter
Conversions
461.90
Actual ROAS
947.25%
Clicks
14.3k
Impressions
476k

The quarter we report on: average ROAS 947.25% from only 14.3k clicks.
Google Ads report — 1 Mar – 31 May 2026 · analysed quarter
Google Ads · 1 Mar – 31 May 2026 · analysed quarter
03 / 05
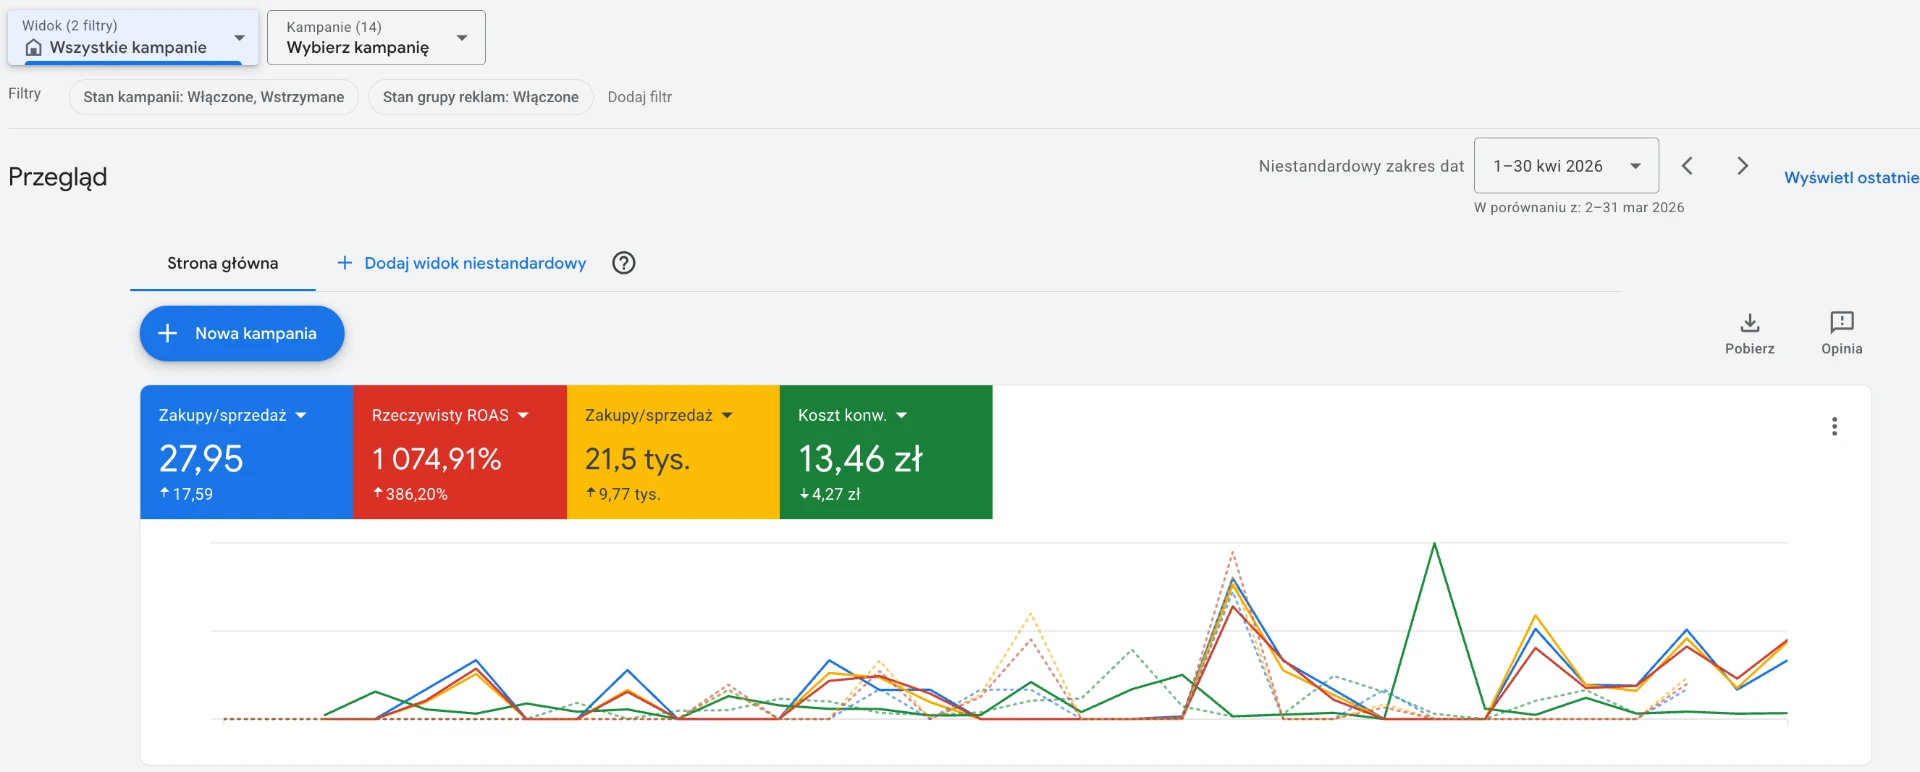
1–30 Apr 2026 vs 2–31 Mar 2026 · peak month
Purchases
27.95 (+17.59)
Actual ROAS
1,074.91% (+386.20 pp)
Sales value
21.5k PLN (+9.77k)
Cost / conv.
13.46 PLN (−4.27)

Peak month. Return climbed while cost per conversion fell — the signature of accurate conversion data.
Google Ads report — 1–30 Apr 2026 vs 2–31 Mar 2026 · peak month
Google Ads · 1–30 Apr 2026 vs 2–31 Mar 2026 · peak month
04 / 05
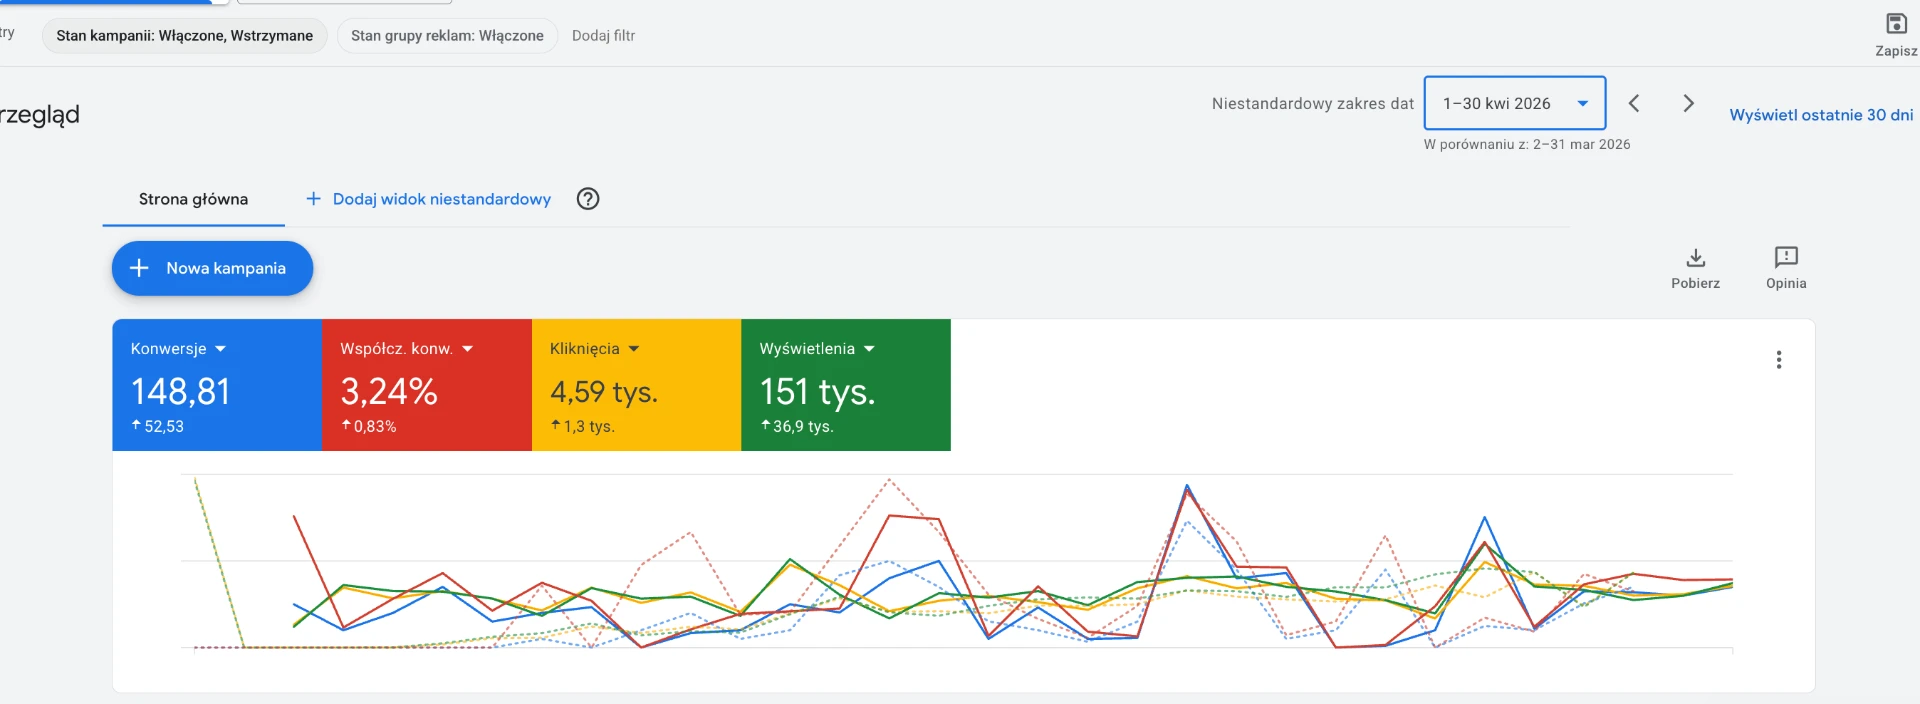
1–30 Apr 2026 vs 2–31 Mar 2026 · volume
Conversions
148.81 (+52.53)
Conv. rate
3.24% (+0.83 pp)
Clicks
4.59k (+1.3k)
Impressions
151k (+36.9k)

Same month, volume view: more conversions at a higher conversion rate, not just more traffic.
Google Ads report — 1–30 Apr 2026 vs 2–31 Mar 2026 · volume
Google Ads · 1–30 Apr 2026 vs 2–31 Mar 2026 · volume
05 / 05
1 Mar – 31 May 2026 vs 29 Nov 2025 – 28 Feb 2026
Purchases
78.55 (+65.55)
Conv. value
64.3k PLN (+60.5k)
Cost / conv.
14.70 PLN (−176)
Conv. rate
2.95% (+2.80 pp)

Quarter over quarter: 13 transactions became 78.55, and cost per conversion dropped by 176 PLN.
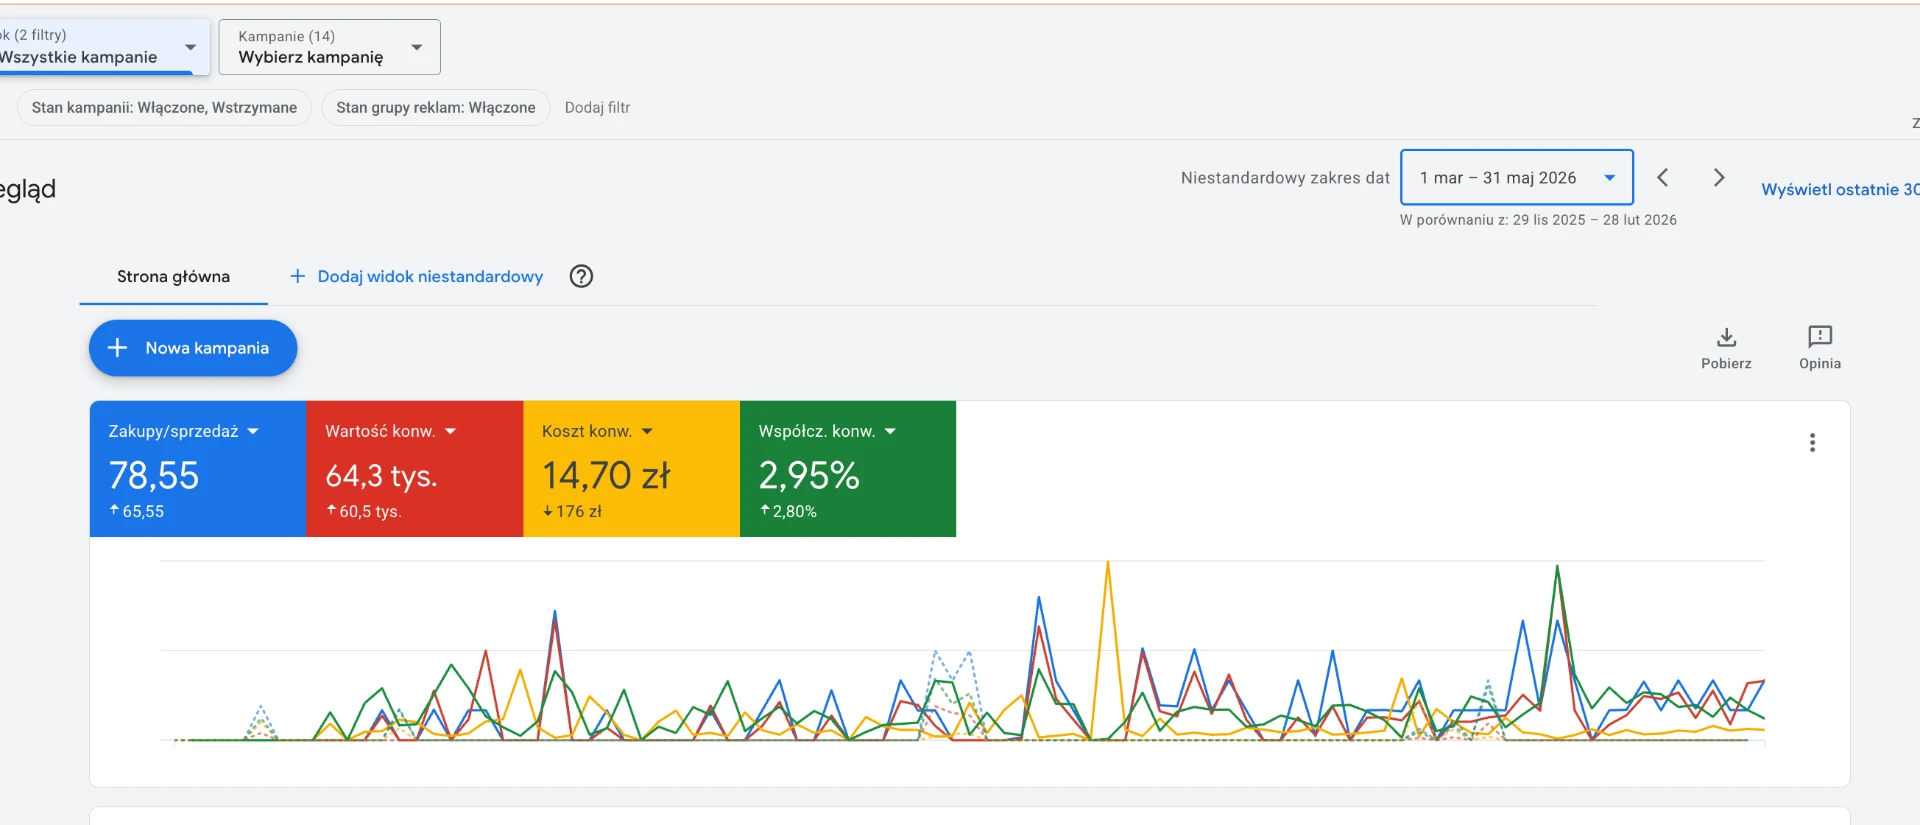
Google Ads report — 1 Mar – 31 May 2026 vs 29 Nov 2025 – 28 Feb 2026
Google Ads · 1 Mar – 31 May 2026 vs 29 Nov 2025 – 28 Feb 2026

Results

First month after the fix

March 2026

689% ROAS

Google finally received precise signals about valuable conversions.

Conversions
96.28
Sales value
11.7k PLN
Cost per conversion
17.73 PLN
Conversion rate
2.41%

Peak month

April 2026

1,075% ROAS

Return climbed while the cost of each conversion fell.

Conversions
148.81
Sales value
21.5k PLN
Cost per conversion
13.46 PLN
Conversion rate
3.24%

Quarter total

1 March – 31 May 2026

947% ROAS

78.55 transactions, against 13 in the quarter before.

Conversions
461.90
Sales value
64.3k PLN
Cost per conversion
14.70 PLN
Conversion rate
2.95%

March figures are April's reported values minus the month-over-month changes shown in Google Ads for 2–31 March.

More client results / 03

Three more accounts, read from the same system.

Live Google Ads accounts we run in home and furniture e-commerce in Poland. Client names are withheld. The softer months stay in.

Closed months: 1 September – 31 October 2026

02 E-commerce · Tables & occasional furniture · Poland

15% more revenue in a month, on the same budget.

1,769%
ROAS, Sep–Oct
+14.8%
Conversion value, Oct vs Sep
+1.1%
Ad spend, Oct vs Sep
55.9PLN
Cost per purchase
Conversion valueAd spend
Augfrom 8 Aug, 24 days
57,696 PLN4,329 PLN
1,333%ROAS
Sep
89,158 PLN5,383 PLN
1,656%ROAS
Oct
102,337 PLN5,441 PLN
1,881%ROAS

How the account is built

01
Split by priceTables moved into two Performance Max campaigns, under and over 1,000 PLN.
02
Bidding on valueSales campaigns switched from maximising conversions to conversion value.
03
Seven campaignsThe product groups, with brand search and remarketing alongside.

What the numbers show

01
More purchases90.4 in September became 103.3 in October.
02
Higher-ticket tablesThe over-1,000-PLN campaign returned 37.5k PLN on 1.5k PLN of spend.
03
Not brand-ledROAS is 1,669% without brand search, which is 7% of value.

What it teaches

When the budget is tight, tell the algorithm what a sale is worth, not only that it happened.

03 E-commerce · Living room & wall units · Poland

A 1,577% return that doesn't lean on brand search.

1,577%
ROAS, Sep–Oct
1,452%
ROAS without brand search
129
Purchases
109PLN
Cost per purchase
Conversion valueAd spend
Augfrom 8 Aug, 24 days
101,658 PLN5,339 PLN
1,904%ROAS
Sep
109,406 PLN6,962 PLN
1,572%ROAS
Oct
112,528 PLN7,114 PLN
1,582%ROAS

How the account is built

01
By product groupPerformance Max split across eight campaigns in total.
02
Brand protectedA separate search campaign for people already looking for the store.
03
Budget follows resultsThe two wall-unit campaigns get the largest share.

What the numbers show

01
One strong categoryWall units bring 65% of value, the main lever and the main risk.
02
Brand kept small10% of conversion value on 2.3% of spend.
03
Steady month to monthSpend +2.2%, conversion value +2.9%, ROAS flat.

What it teaches

Report ROAS with and without brand. The second number is the one that shows new demand.

04 E-commerce · Sofas & upholstered furniture · Poland

265k PLN in two months, and where the next gain sits.

265.4kPLN
Conversion value, Sep–Oct
957%
ROAS, Sep–Oct
159
Purchases
174PLN
Cost per purchase
Conversion valueAd spend
Augfrom 8 Aug, 24 days
126,803 PLN10,192 PLN
1,244%ROAS
Sep
139,009 PLN13,898 PLN
1,000%ROAS
Oct
126,422 PLN13,829 PLN
914%ROAS

How the account is built

01
Largest budget27.7k PLN across 15 campaigns.
02
By category and pricePerformance Max by product, with wall units split by price band.
03
Best performerCorner sofas, 75.2k PLN of value on 3.4k PLN of spend.

What the numbers show

01
Concentrated returnThe top three campaigns bring 62% of value from 45% of spend.
02
First to reviewTwo campaigns spent 1.1k PLN with no recorded value.
03
The softer monthOctober value fell 9% on flat spend, ROAS from 1,000% to 914%.

What it teaches

At this size, the gain is in moving budget toward what already works, not in adding more.

How to read these numbers: conversion value and purchases are as reported by Google Ads and imported daily into our system, on 6 November 2026. ROAS is conversion value divided by ad spend. Figures don't include margin. August starts on the first imported day, so it isn't a full month and isn't used in the totals.